542housingproject
During the fall 2012 semester, I was enrolled in Janet Smith's Metropolitan Housing Planning course at UIC. We were tasked with developing a housing plan for one of Chicago's community areas. My group focused on East Garfield Park, and the artifacts here are merely portions of the overall plan.
focusing on a special population
Our housing plans addressed several special populations, including the elderly, people with disabilities, and low income residents. I chose to focus my individual analysis on the low income population of East Garfield Park. I was concerned that we not develop a plan that would lead to gentrification and pricing-out the current residents, so I believed it was important to examine to what extent East Garfield Park's population was living in poverty. This short analysis included census data and a review of past community work. These two tables from the appendix are a glimpse into the short analysis. Several basic GIS maps are included at the end of the document to illustrate the low income populations.

2010 household income and benefits, with a look at the number of low income households in East Garfield Park

monthly housing costs as a percentage ofhousehold income
a visual look at East Garfield Park
In addition to my look at the low income residents of East Garfield Park, I created a number of maps and conducted some spatial analysis for our plan using ArcGIS.
Several maps take a current look at the area, including bus and rail service, zoning and Tax Increment Financing districts.

public transportation in East Garfield Park

East Garfield Park zoning with building footprints
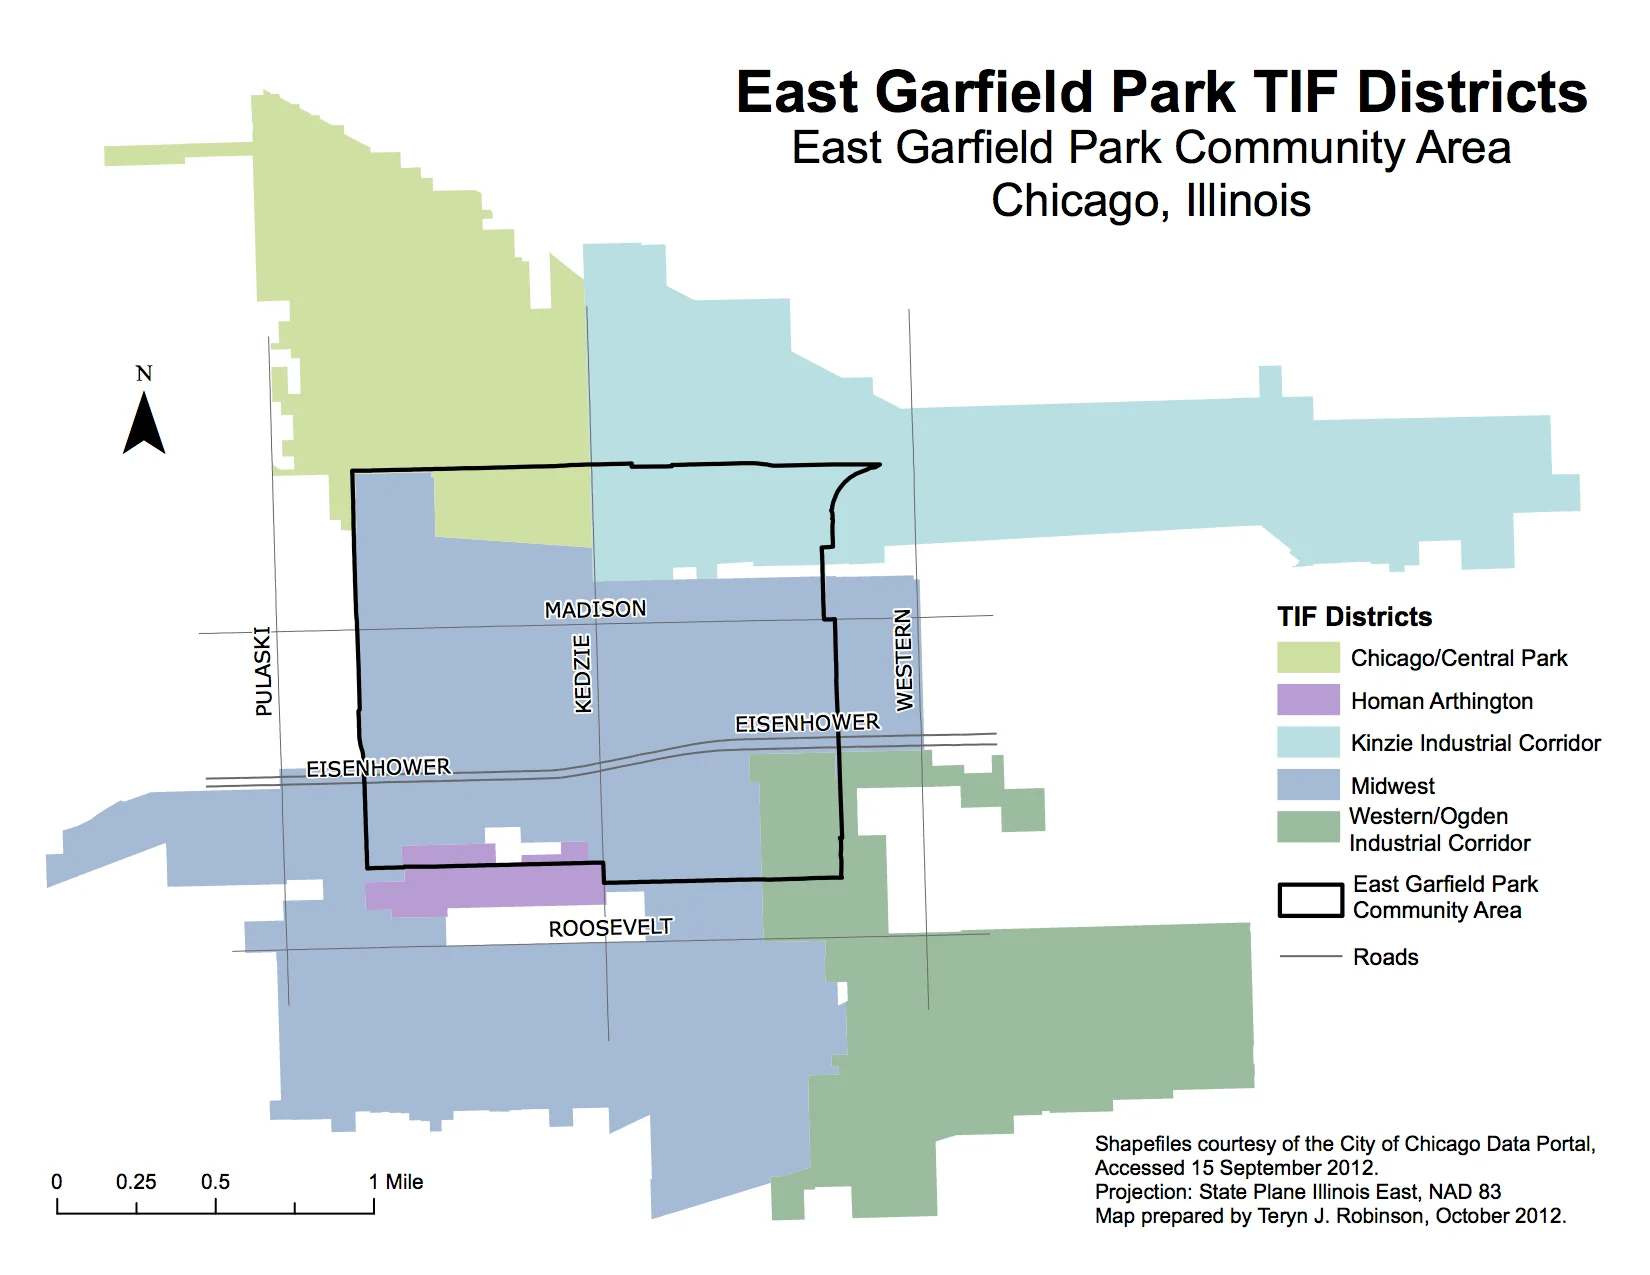
tax increment financing districts in East Garfield Park
Other maps take the examination of East Garfield Park a step further.
Of all of the maps I created for this project, I continue to be most proud of this map. With our special populations including the elderly and low income residents of East Garfield Park, access to public transportation is crucial. Using ArcGIS's Network Analyst, I created a map that shows paths--true to the roads of East Garfield Park--within 1/4, 1/2, and 1 mile of Chicago Transit Authority rail stations.

zones representing true walking distances to rail stations
In addition to considering Census/American Community Survey data on income, housing costs, and poverty, I wanted to incorporate data from the Center for Neighborhood Technology's Housing + Transportation Index. CNT's data is at the census block level, and I opted to layer that with the Census data for a deeper look at the true costs of living in East Garfield Park.

areas in East Garfield Park with high need for affordable housing
With the Chicago Housing Authority's redevelopment of former public housing sites still unfinished, we had the opportunity to reexamine the former site of Rockwell Gardens. This map looks at current (then 2012) building footprints and zoning.

zoning and building footprints of the former site of Rockwell Gardens
WBEZ's presentation gang territories in Chicago intrigued me. While the boundaries are never static, I believed a look at gang territory could still show complexities in the community area.

a look at gang territories in and near East Garfield Park